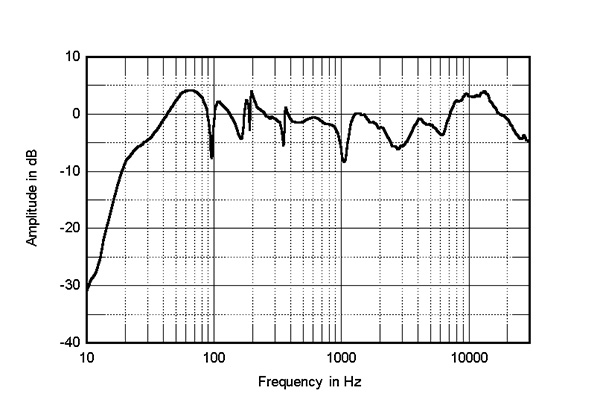
Question: when FR graph such as those above show the db level at, say, 1khz, does the measured response include any other frequencies - such as resonances introduced by the speaker?
Also, I assume, the graphs alone do not reflect phase consistency between a fundamental and the harmonics typical in music, or differing decay rates for the fundamental vs harmonics. I believe these factors are critical for imaging and musical realism.


