@magon "I’m wondering if the McIntosh signature sound is known for good dynamics and microdynamics."
Absolutely, McIntosh typically specs any of their amplifiers as having at least 1.8 dB of dynamic headroom and independent tests reveal they easily exceed that. I’ve included an excerpt of John Atkinson’s technical analysis of the McIntosh MAC7200 receiver Larry Greenhill reviewed in the December 2020 issue of Stereophile and attached the link to the article in it’s entirety for you to read if you so choose.
https://www.stereophile.com/content/mcintosh-mac7200-stereo-receiver
Figs.5, 6, and 7 plot the percentage of THD+noise in the MAC7200’s speaker output from the 8 ohm tap into 8 ohms, the 4 ohm tap into 4 ohms, and the 2 ohm tap into 2 ohms. In each graph, the THD+N continues to drop as the power decreases below actual waveform clipping, due to the distortion lying beneath the noise floor and the fixed level of noise becoming an increasing percentage of the signal level. The receiver’s maximum power is specified as being at least 200W from each of the output-transformer taps. Using our definition of clipping, which is when the output’s percentage of THD+noise reaches 1%, the 8 ohm tap clipped at 255W into 8 ohms (24dBW) with both channels driven, the 4 ohm tap at 235W into 4 ohms (20.7dBW) with both channels driven, and the 2 ohm tap at 283W into 2 ohms (18.5dBW) with one channel driven. More power was available when the load impedance was lower than the nominal tap impedance. For example, with its 8 ohm tap driving 4 ohms, the McIntosh clipped at 340W into 4 ohms (22.3dBW, fig.8).
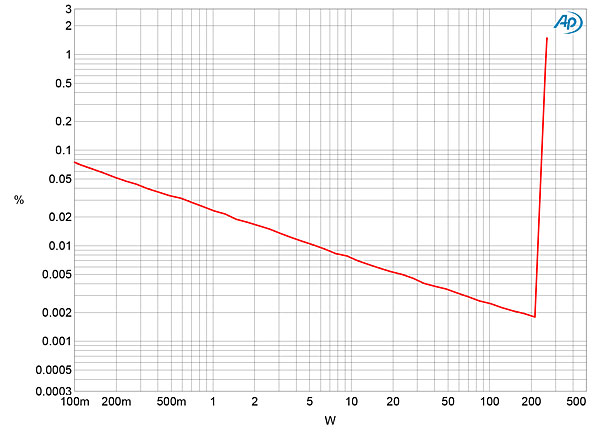
Fig.5 McIntosh MAC7200, 8 ohm tap, distortion (%) vs 1kHz continuous output power into 8 ohms.
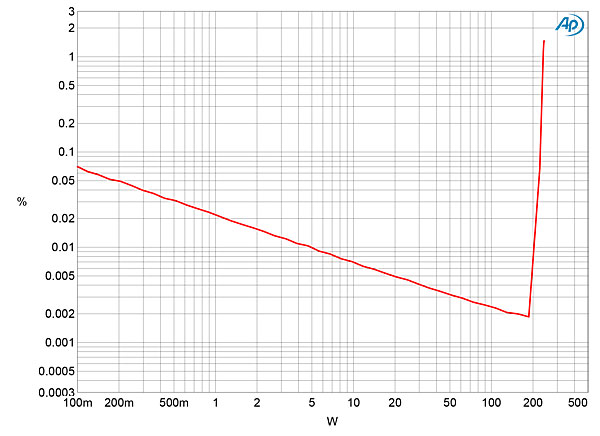
Fig.6 McIntosh MAC7200, 4 ohm tap, distortion (%) vs 1kHz continuous output power into 4 ohms.
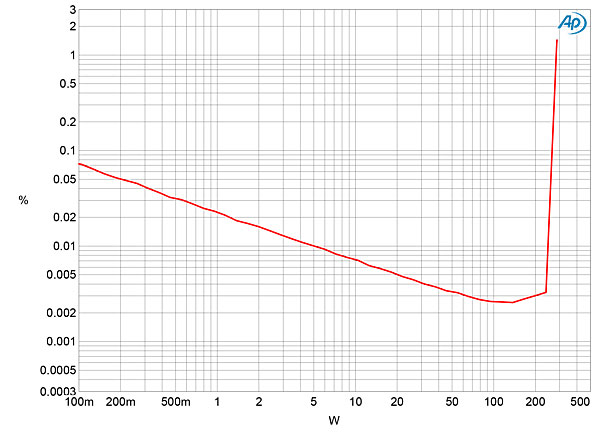
Fig.7 McIntosh MAC7200, 2 ohm tap, distortion (%) vs 1kHz continuous output power into 2 ohms.
I measured how the MAC7200’s distortion changed with frequency at 20V output, which is equivalent to 50W into 8 ohms and 100W into 4 ohms. The THD+N percentage was very low into both loads (fig.9) and didn’t increase at the top of the audioband. As suspected from the clipping graphs, the measurement was being dominated by random noise, which can also be seen in the waveform of the THD+N spuriae (fig.10). A hint of second harmonic can be just made out in this graph, which was confirmed by spectral analysis (fig.11). Intermodulation distortion was also vanishingly low (fig.12).
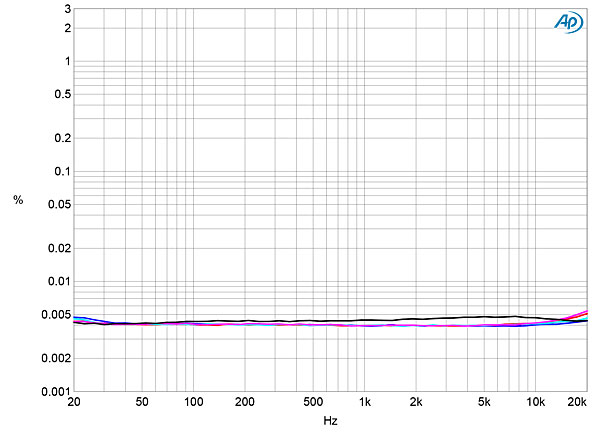
Fig.9 McIntosh MAC7200, 8 ohm tap, THD+N (%) vs frequency at 20V into 8 ohms (left blue, right red) and 4 ohms (left cyan, right magenta).
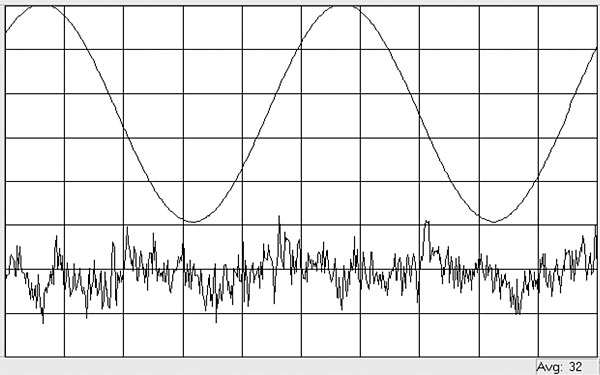
Fig.10 McIntosh MAC7200, 8 ohm tap, 1kHz waveform at 100W into 8 ohms, 0.0043% THD+N (top); distortion and noise waveform with fundamental notched out (bottom, not to scale).
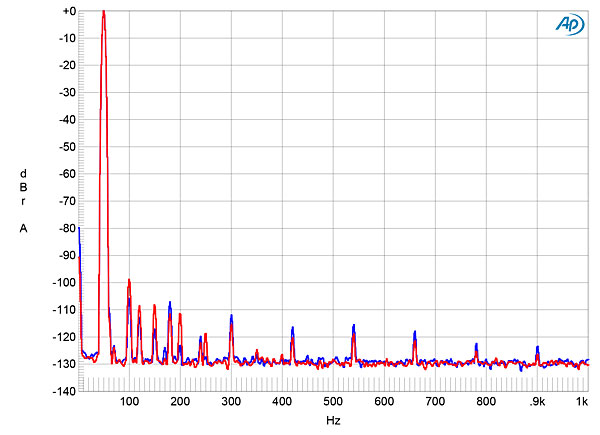
Fig.11 McIntosh MAC7200, 8 ohm tap, spectrum of 50Hz sinewave, DC–1kHz, at 100W into 8 ohms (left channel blue, right red, linear frequency scale).
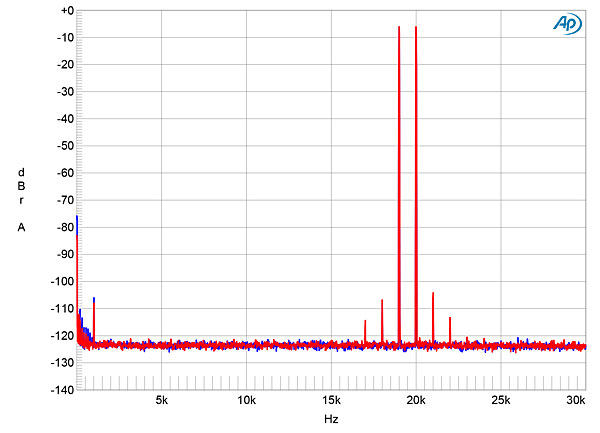
Fig.12 McIntosh MAC7200, 8 ohm tap, HF intermodulation spectrum, DC–30kHz, 19+20kHz at 100W peak into 8 ohms (linear frequency scale).