@puffbojie
The Dirac gives you the option to take a picture of FR graph which I always do but have no idea where it goes.
Maybe a pictures folder? I use windows so that's my best guess. You will need to upload the pic to your virtual system (see mine as an example) and from their you can copy and paste it into a post like this.
Would love anyone’s insight on what that graph represents once I get it posted.
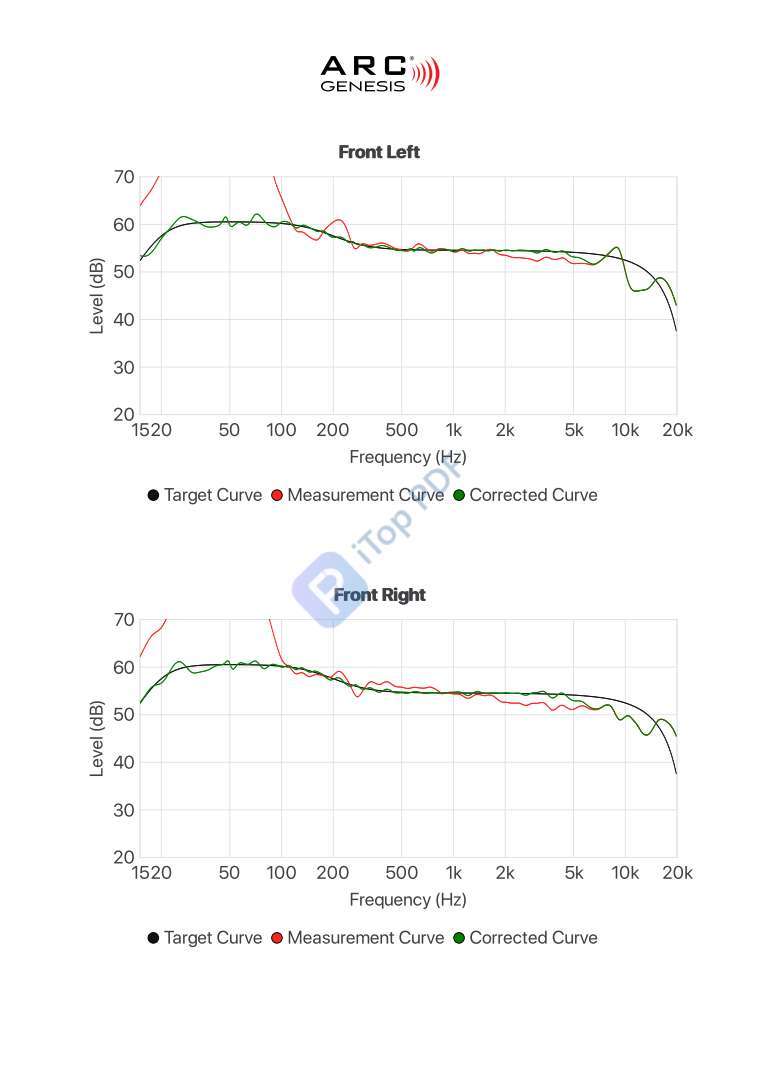
I don't use Dirac but here is an example from my streamers ARC room correction. The software offers you a choice of target response curves and you choose one. Then you get a before and after comparison. On the left axis is the decibel level, the bottom axis are the frequencies. The software attempts to match your in room response as closely as possible to the response curve. DSP can cut frequencies that are too high above the curve, but can't lift the frequencies that are below it, the bass. For that you need to try room treatments, moving your speakers away from or toward the wall, etc.